
After grappling for weeks with what community means, we have turned to an even knottier issue: how community can be measured. A key tenet of social science is the idea that we measure what we care about, and we care about what we measure, but our group learned quickly that this is easier said than done. The more we explored community metrics, the more questions emerged… How do we align our values and our measures? How do we make sure we’re measuring the right things? And once we have the data, what do we do with it?
Our unit began with an exploration of real-world measurement and data illustration. We spent time with a variety of approaches to quantitative thinking, including the Dear Data project, and the work of Mona Chalabi. Luckily, we were able to partner briefly with local expert, Jane Adams, a Data Visualization Specialist with the UVM Complex Systems Center. She introduced us to her work at Champlain College’s Emergent Media Center, and her current endeavors at UVM (including the Hedonometer).
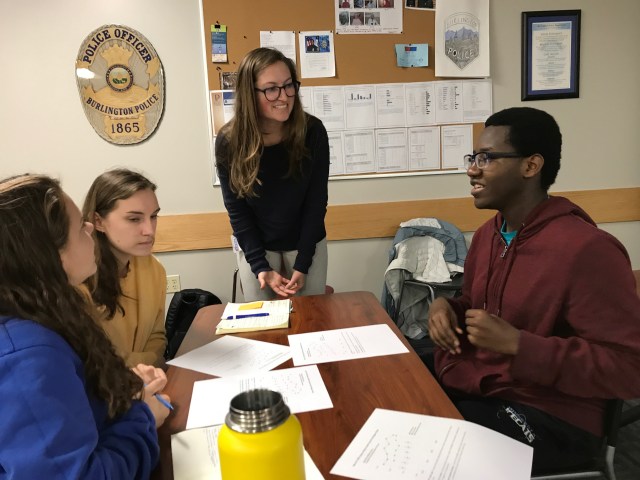
From there, we turned our attention to real world applications of data, and the challenge of connecting data to decision-making. Heather Danis and Emily Fredette, from the Vermont Department of Health, offered small groups of BCL students an opportunity to engage with and consult on population-level stats related to nicotine use, obesity, exercise, and substance abuse in Burlington.

We then applied our nascent understanding of public health to one of the most complex issues our community is facing: the opioid crisis. Students researched the crisis’s recent history, explored data available through the Department of Health, read obituaries, listened to survivors’ stories, and began to connect the dots between addiction, recovery, crime, and community health. We met with prevention educators, therapists, and staff from the Chittenden County Opioid Alliance. And while the issue remains as complex as ever, we increased our ability to ask informed questions, and to keep the humanity of those affected by the crisis at the center of our inquiry.
Overall, I would say that many of the Chittenden County data points are hopeful and show progress. However, as steps are taken to help the crisis, new issues arise. For instance, even though heroin and opioid deaths are decreasing, fentanyl deaths are increasing. Why is this? Also, why do more people go to the emergency department for heroin overdose, as the number of people who receive emergency treatment for opioids decreases? Lastly, why is the number of users seeking MAT decreasing? In the Seven Days article, it seems clear that MAT is effective –but why would the number of new MAT patients be decreasing as treatments become more available, with waiting lists at 0?
- Maggie
The reading we did and the people we met really highlighted for me just how hard it is to quit. One quote that really stood out to me from the reading was “When I want to use, it’s overpowering. Nothing in this world is as strong as that. They say God is, but I have a hard time believing it, because anytime I want to get high, my addiction decides to before I do. It’s a horrible place to be.” It was amazing to see this comparison between addiction and something like God… This really made me understand just how hard it is to stop using. The user isn’t the one who decides–the drugs are.
- Sam

In class, we learned that “We measure what we care about, and we care about what we measure.” To me, this means that the things we look at and quantify and spend time evaluating need to be the things that we as a community value and care about. This isn’t always easy. When you start measuring something it may change the data because when you are noticing something and reporting it may cause bias.
- Zaley

It’s important to measure things that might cause harm to a healthy community.
- Khalid
The challenge is finding what in data is actually useful and actionable, and what is just noise.
- Owen
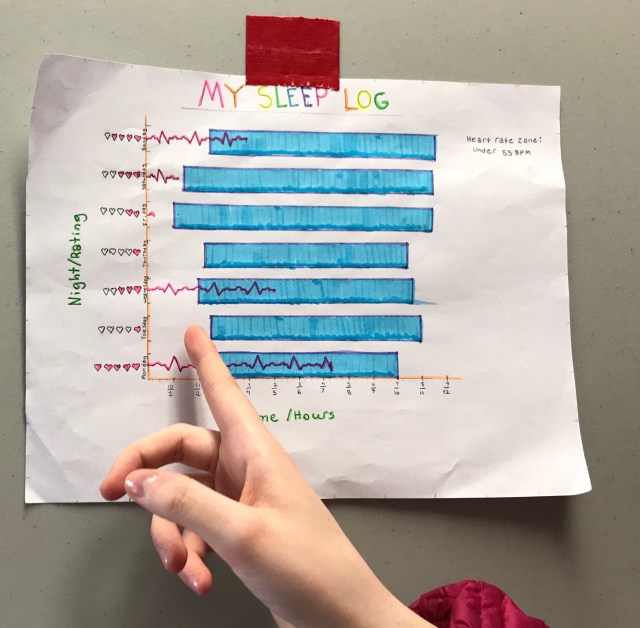
Towards the end of our unit that focused on community metrics, students identified areas in their own lives to which they could apply some quantitative thinking. They collected data and began to play with how that data might be illustrated. Each project was fascinating.


To measure what we care about, we first need to identify what we truly care about. Then, we must find an accurate way to collect data and represent it. To me, sharing a meal and eating lunch with friends builds community and strengthens relationships. This is why I measured who eats in which parts of the BHS campus. For a community to thrive, it needs many different locations were people can spread out, eat lunch, and hangout with their friends. For a community to thrive, it needs to be given the time and space for thriving to occur.
- Ruby
I found tracking the data really tricky because I needed to consciously remember/think about when I talked to my subject in order to record it. My data may be skewed purely because I got better at tracking the more I did it. I also needed to set parameters for what constituted a “conversation.” A hello? A question and answer? A full on five minute conversation? This made my data tricky to keep constant, although it was still really interesting to see the final product.
- Abby
I enjoyed the experience of collecting data because it made me think of how data can be useful in different ways, I hadn’t really thought about how I could use data in my own life, but looking at how the results can be used to make changes or influence behavior helps me see how I can use personal data to make positive changes. When doing this, I thought about how it related to my inquiry project. After all, in public health data is everything. It allows us to see patterns and trends in the health of a community and it can facilitate policy changes along with other changes to try and improve the health in a community.
- Zaley
For my data project I measured 4 things. They were foods I ate, hours of sleep, energy levels, and wasted time. I kept track of all of this data by briefly writing in my personal journal 3-4 times a day for a week. I thought that this would be a chance I could take at making self improvement. Ideally, I could look back on this project and say that I eat healthier, sleep more, have more energy and waste less time… I do think that doing this project is at least a good guiding metric for self improvement because you can better understand how to deal with your own problems.
- James


Thanks for the opportunity to spend some time with students and staff. It was a wonderful experience! We look forward to future opportunities for collaboration.
LikeLike