

When people hear the word “data,” they seem to fall into two camps. Some get excited, and others — okay, most of us — glaze over. This is understandable, since graphs, and spreadsheets often seem flat and lifeless, especially compared to the colorful, three-dimensional space in which our lives unfold. Over the past few weeks, however, Burlington City & Lake Semester [BCL] students have engaged in myriad ways with quantitative measurement, and students will be the first to admit it: playing with data has opened our eyes.
In October, BCL boarded the Melosira, UVM’s lake research vessel. Together with two field scientists, students headed out to the broad lake, where the depth is more than 100 meters. There, biologist Rosie Chapina invited us to support her research on mysids–small shrimp-like crustaceans, millions of which live in Lake Champlain. Although they are small, their impact is mighty: their position near the bottom of the food web means that their health helps to anchor an entire ecosystem.


Supporting Rosie’s mysid research was uplifting. It was exciting to be on the front edge of new knowledge. But not all science makes you feel good. Some information is essential — but heartbreaking. Students learned this firsthand when they partnered with Ashley Sullivan and the Rozalia Project, a global organization whose goal is to reshape what we know about and how we approach a fast-moving crisis: marine debris.
It is only in the last few years that public awareness of plastic contamination has begun to emerge, and regulations and policies lag far behind. In a situation like this, data becomes imperative. The people who can help reshape our economy need to understand how big the problem is and what its impacts are. Which is why, on one of Fall’s last warm days, we met Ashley at North Beach, and got to work setting up transects, and counting trash.

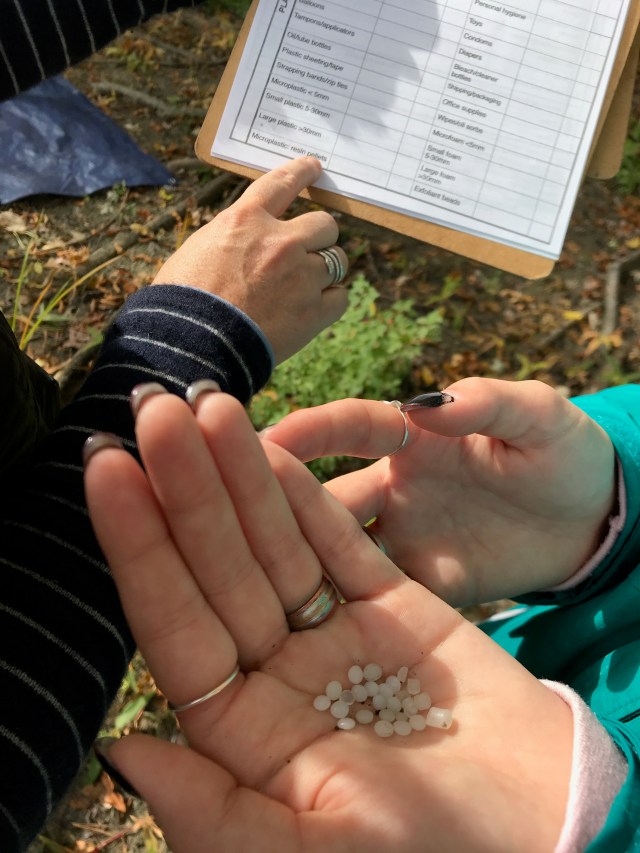
What we found was staggering. In our 90 minutes of research, our group collected 1576 individual pieces of consumer waste. Of these, 1542 — nearly 98% — were plastic. At the micro-level, the results were just as stunning. In the corners of students’ transects where logs or dunes caught incoming debris, the microplastics in a few square feet were literally uncountable.
It was crazy that a group had just done a clean up of North Beach three weeks before we got there. I just couldn’t believe that.
- Lily
When we started, we didn’t expect to find a single resin pellet, but once you knew what to look for, you see them everywhere.
- Jonathan
In the area where we were supposed to measure and count the things that weren’t from nature, we found a piece of styrofoam that seems like it exploded. The stuff was everywhere. There was so much we stopped counting–and didn’t stop picking it up.
- Dadir

Throughout the past few weeks, our guiding principle has been an idea that is true for all domains, and all data: We measure what we care about, and we care about what we measure. This is an essential concept, since it reminds us that data is intimately linked to values. After all, data collection is an extension of what we pay attention to. The result is that we care about, as individuals or as a society, gets measured — and the things we measure have real power to influence our sense of what’s important.
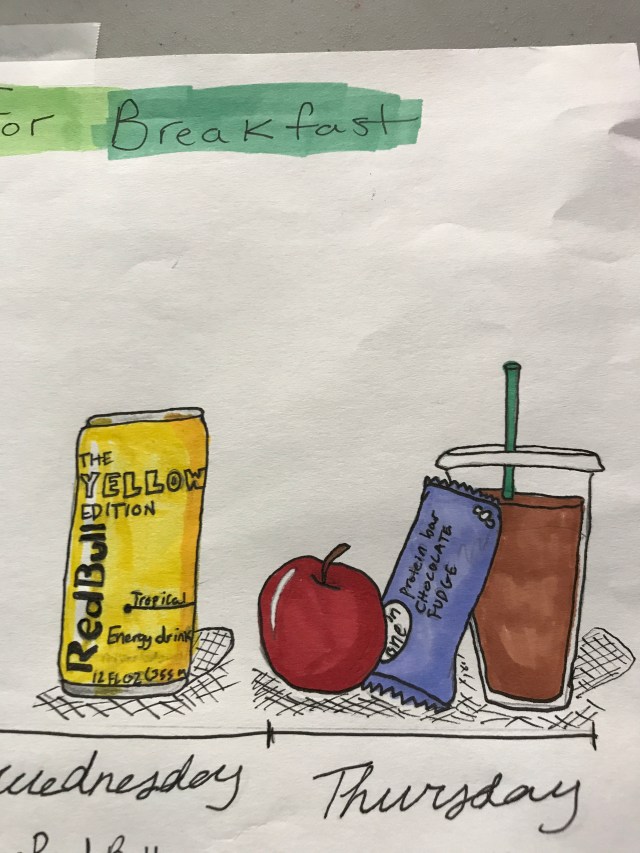
Students explored a variety of ways that the collection and dissemination of data can have meaning and impact. Mona Chalabi’s work was especially inspiring, as was the Dear Data project, and the data-sonification of Brian Foo. When it was time for students to collect data from their own lives — and visualize it! — the results were relevant, and powerful.


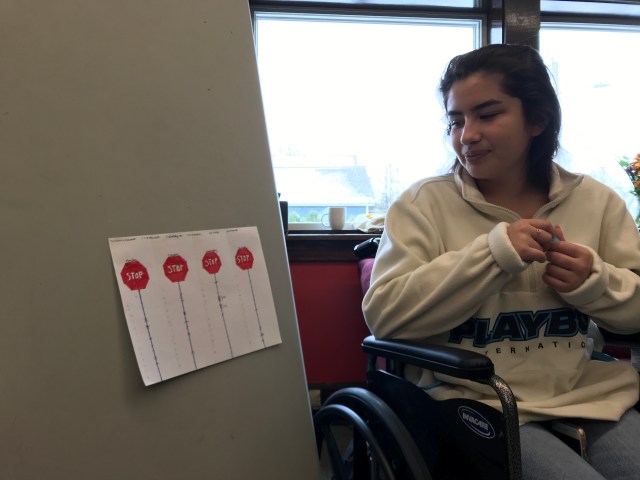

We don’t even realize how we communicate all the time. But we can decide to start a conversation, and this is our choice. This is one of the reasons why I wanted to collect data. Building a good conversation is art. You need to be creative and generate questions. In my visualization, you can see the different results if I just said “Hi” to a person, or if I asked an actual question.
- Joris


I thought this experience was enlightening because with recent developments, I would’ve thought that climate health would have been an overwhelming priority for high schoolers, but in reality having a world exempt of poverty is a higher priority. I also thought that it was interesting to observe my peers’ data collection, and see what is important and quantifiable to them in their everyday life.
- Kofi
It was great to see how different everyone’s approach was to presenting their data. People were so creative. It made looking at everyone’s work super interesting.
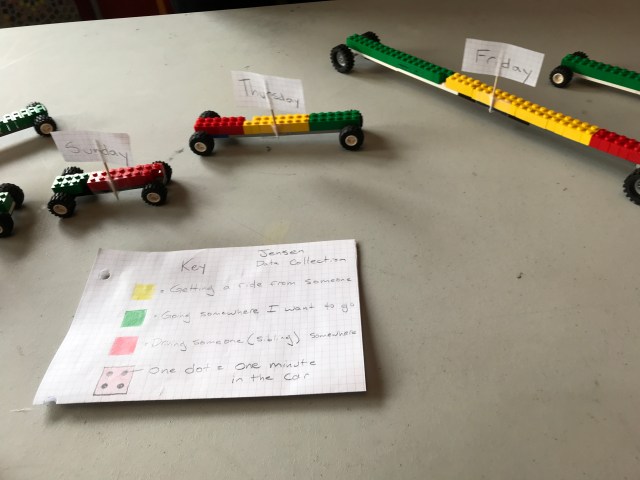
- Jensen
I enjoyed this data collecting project! I appreciated doing it so much because I was tracking my habits, whereas most projects I do are focused more on academic data, and nothing that applies to my life… I never considered myself a numbers, or data person until I finished this project. It has helped shape, and alter my self-stigma around data. I never knew that it can be represented in such an intriguing and creative way.
- Lily
Jory Hearst, a BHS English teacher, joined us for students’ data visualization presentations. We knew that Jory would bring energy and engagement, but had no idea how relevant students’ work would be to her own learning. Jory’s reflection captures the spirit of the day–and helps put students’ work in a broader context.
I had a blast visiting BCL on Friday as students were presenting their data projects. It was funny timing, because I had just finished reading W.E.B. Du Bois’ Data Portraits, where he painted a picture of the black experience in the US circa 1900. Du Bois presents data in a variety of creative and beautiful formats. His goal was to elevate the African-American experience as important and worthy of attention.
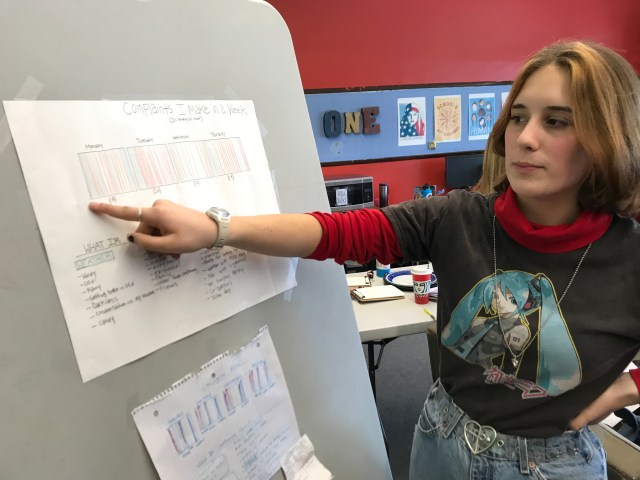
The BCL students picked up exactly where he left off: collecting data on something impacting their own lives and presenting it in a format that fit the data they were presenting. From measuring interactions with others to measuring the number of complaints made in a day, to how much they had to drive their siblings around during the week, to analyzing their screen time, it was obvious that students were using data in a meaningful way to help learn something about their lives.
As an audience member, I was able to ask them lots of questions, and then hear all of their reflections. This was the most powerful part; hearing students see the ways the data they collected could made an impact in their lives was a perfect jumping off point to look at data the city of Burlington is collecting. As Du Bois makes a case for in his Data Portraits, data matters, and how we present it can help it land with the right audience. I’m so grateful to BCL for welcoming visitors, and letting me think and reflect along with them.
- Jory Hearst, BHS English Teacher
